Blazor quietly marches on. In case you haven't heard (I've blogged about Blazor before) it's based on a deceptively simple idea - what if we could run .NET Standard code in the browsers? No, not Silverlight, Blazor requires no plugins and doesn't introduce new UI concepts. What if we took the AOT (Ahead of Time) compilation work pioneered by Mono and Xamarin that can compile C# to Web Assembly (WASM) and added a nice UI that embraced HTML and the DOM?
Sound bonkers to you? Are you a hater? Think this solution is dumb or not for you? To the left.
For those of you who want to be wacky and amazing, consider if you can do this and the command line:
$ cat hello.cs

class Hello {

  static int Main(string[] args) {

    System.Console.WriteLine("hello world!");

    return 0;

  }

}

$ mcs -nostdlib -noconfig -r:../../dist/lib/mscorlib.dll hello.cs -out:hello.exe

$ mono-wasm -i hello.exe -o output

$ ls output

hello.exe        index.html        index.js        index.wasm        mscorlib.dll
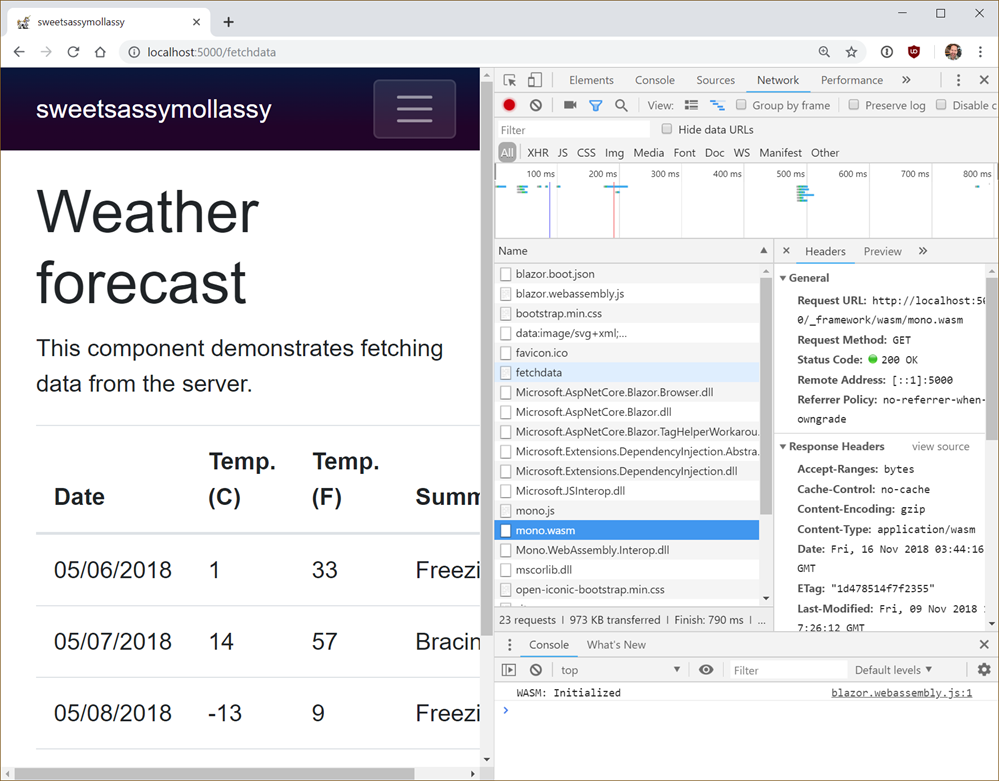
Then you could do this in the browser...look closely on the right side there.
You can see the Mono runtime compiled to WASM coming down. Note that Blazor IS NOT compiling your app into WASM. It's sending Mono (compiled as WASM) down to the client, then sending your .NET Standard application DLLs unchanged down to run within with the context of a client side runtime. All using Open Web tools. All Open Source.

So Blazor allows you to make SPA (Single Page Apps) much like the Angular/Vue/React, etc apps out there today, except you're only writing C# and Razor(HTML).
Consider this basic example.
@page "/counter"


<h1>Counter</h1>

<p>Current count: @currentCount</p>

<button class="btn btn-primary" onclick="@IncrementCount">Click me</button>


@functions {

    int currentCount = 0;

    void IncrementCount() {

        currentCount++;

    }

}
You hit the button, it calls some C# that increments a variable. That variable is referenced higher up and automatically updated. This is trivial example. Check out the source for FlightFinder for a real Blazor application.
This is stupid, Scott. How do I debug this mess? I see you're using Chrome but seriously, you're compiling C# and running in the browser with Web Assembly (how prescient) but it's an undebuggable black box of a mess, right?
I say nay nay!
C:\Users\scott\Desktop\sweetsassymollassy> $Env:ASPNETCORE_ENVIRONMENT = "Development"

C:\Users\scott\Desktop\sweetsassymollassy> dotnet run --configuration Debug

Hosting environment: Development

Content root path: C:\Users\scott\Desktop\sweetsassymollassy

Now listening on: http://localhost:5000

Now listening on: https://localhost:5001

Application started. Press Ctrl+C to shut down.
Then Win+R and run this command (after shutting down all the Chrome instances)
%programfiles(x86)%\Google\Chrome\Application\chrome.exe --remote-debugging-port=9222 http://localhost:5000
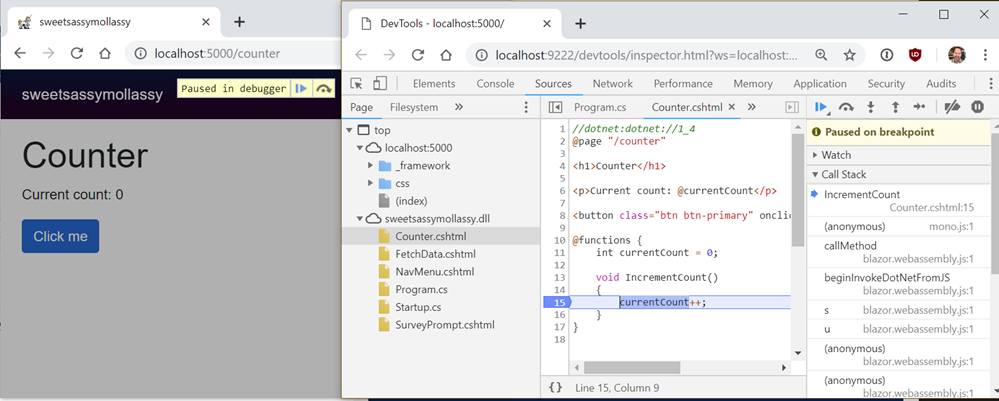
Now with your Blazor app running, hit Shift+ALT+D (or Shift+SILLYMACKEY+D) and behold.
Feel free to click and zoom in. We're at a breakpoint in some C# within a Razor page...in Chrome DevTools.

What? How?
Blazor provides a debugging proxy that implements the Chrome DevTools Protocol and augments the protocol with .NET-specific information. When debugging keyboard shortcut is pressed, Blazor points the Chrome DevTools at the proxy. The proxy connects to the browser window you're seeking to debug (hence the need to enable remote debugging).
It's just getting started. It's limited, but it's awesome. Amazing work being done by lots of teams all coming together into a lovely new choice for the open source web.
Sponsor: Preview the latest JetBrains Rider with its Assembly Explorer, Git Submodules, SQL language injections, integrated performance profiler and more advanced Unity support.
© 2018 Scott Hanselman. All rights reserved.


