With Visual Studio Code and WSL (Windows Subsystem for Linux) you can be in a real Linux environment and run "code ." from the Linux prompt and Visual Studio Code will launch in Windows and effectively split in half. A VSCode-Server will run in Linux and manage the Language Services, Debugger, etc, while Windows runs your VS Code instance. You can use VS Code to develop on remote machines over SSH as well and it works great. In fact there's a whole series of Remote Tutorials to check out here.
VS Code is a great Code Editor but it's not a full IDE (Integrated Development Environment) so there's still lots of reasons for me to use and enjoy Visual Studio on Windows (or Mac).
I wanted to see if it's possible to do 'remote' debugging with WSL and Visual Studio (not Code) and if so, is it something YOU are interested in, Dear Reader.
- To start, I've got WSL (specifically WSL2) on my Windows 10 machine. You can get WSL1 today on Windows from "windows features" just by adding it. You can get WSL2 today in the Windows Insiders "Slow Ring."
- Then I've got the new Windows Terminal. Not needed for this, but it's awesome if you like the command line.
- I've got Visual Studio 2019 Community
I'm also using .NET Core with C# for my platform and language of choice. I've installed from https://dot.net/ inside Ubuntu 18.04, under Windows. I've got a web app (dotnet new razor) that runs great in Linux now.

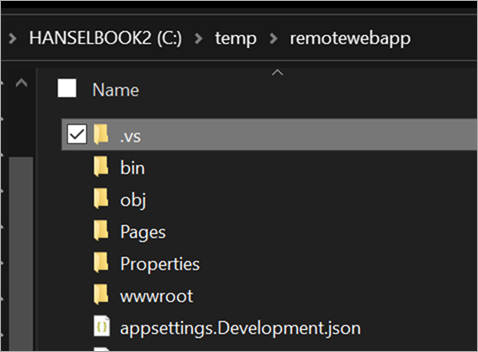
From the WSL prompt within terminal, I can run "explorer.exe ." and it will launch Windows Explorer at the path \\wsl$\Ubuntu-18.04\home\scott\remotewebapp, but VS currently has some issues opening projects across this network boundary. I'll instead put my stuff at c:\temp\remotewebapp and access it from Linux as /mnt/c/temp/remotewebapp.

In a perfect world - this is future speculation/brainstorming, Visual Studio would detect when you opened a project from a Linux path and "Do The Right Thing(tm)."
I'll need to make sure the VSDbg is installed in WSL/Linux first. That's done automatically with VS Code but I'll do it manually in one line like this:
curl -sSL https://aka.ms/getvsdbgsh | /bin/sh /dev/stdin -v latest -l ~/vsdbg
We'll need a launch.json file with enough information to launch the project, attach to it with the debugger, and notice when things have started. VS Code will make this for you. In some theoretical future Visual Studio would also detect the context and generate this file for you. Here's mine, I put it in .vs/launch.json in the project folder.
VS will make a launch.json also but you'll need to add the two most important parts, the $adapter and $adapterArgs part as I have here.
{

   // Use IntelliSense to find out which attributes exist for C# debugging

   // Use hover for the description of the existing attributes

   // For further information visit https://github.com/OmniSharp/omnisharp-vscode/blob/master/debugger-launchjson.md

   "version": "0.2.0",

   "configurations": [

    {

      "$adapter": "C:\\windows\\sysnative\\bash.exe",

      "$adapterArgs": "-c ~/vsdbg/vsdbg",

      "name": ".NET Core Launch (web)",

      "type": "coreclr",

      "request": "launch",

      "preLaunchTask": "build",

      // If you have changed target frameworks, make sure to update the program path.

      "program": "/mnt/c/temp/remotewebapp/bin/Debug/netcoreapp3.0/remotewebapp.dll",

      "args": [],

      "cwd": "/mnt/c/temp/remotewebapp",

      "stopAtEntry": false,

      // Enable launching a web browser when ASP.NET Core starts. For more information: https://aka.ms/VSCode-CS-LaunchJson-WebBrowser

      "serverReadyAction": {

        "action": "openExternally",

        "pattern": "^\\s*Now listening on:\\s+(https?://\\S+)"

      },

      "env": {

        "ASPNETCORE_ENVIRONMENT": "Development"

      },

      "sourceFileMap": {

        "/Views": "${workspaceFolder}/Views"

      },

      "pipeTransport": {

        "pipeCwd": "${workspaceRoot}",

        "pipeProgram": "bash.exe",

        "pipeArgs": [ "-c" ],

        "debuggerPath": "~/vsdbg/vsdbg"

      },

      "logging": { "engineLogging": true }

    }

    ]

}
These launch.json files are used by VS and VS Code and other stuff and give the system and debugger enough to go on. There's no way I know of to automate this next step and attach it to a button like "Start Debugging" - that would be new work in VS - but you can start it like this by calling a VS2019 automation command from the "Command Window" you can access with View | Other Windows | Command Window, or Ctrl-Alt-A.
Once I've typed this once in the Command Window, I can start the next Debug session by just pressing Up Arrow to get the command from history and hitting enter. Again, not perfect, but a start.
DebugAdapterHost.Launch /LaunchJson:C:\temp\remotewebapp\.vs\launch.json
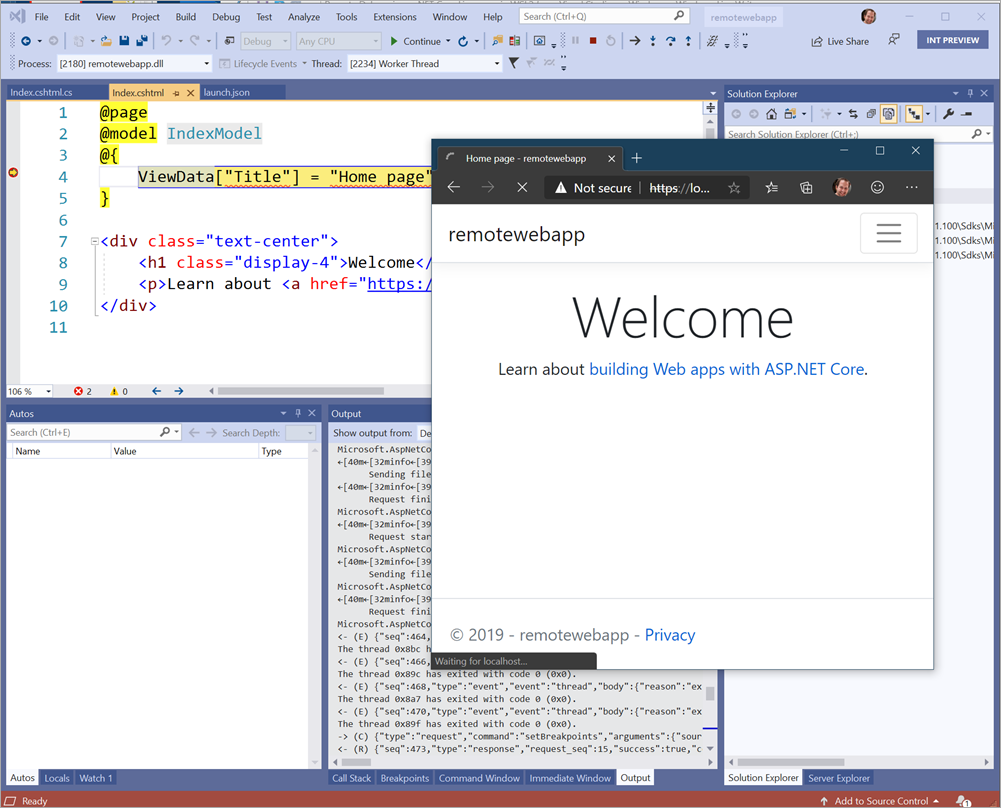
Here's a screenshot of me debugging a .NET Core app running in Linux under WSL from Windows Visual Studio 2019.

Thanks to Andy Sterland for helping me get this working.
So, it's possible, but it's not falling-off-a-log automatic. Should this setup and prep be automatic? Is development in WSL from Visual Studio (not Code) something you want? There is great support for Docker development within a container including interactive debugging already, so where do you see this fitting in...if at all? Does this add something or is it more convenient? Would you like "F5" debugging for WSL apps within VS like you can in VS Code?
Sponsor: Like C#? We do too! That’s why we've developed a fast, smart, cross-platform .NET IDE which gives you even more coding power. Clever code analysis, rich code completion, instant search and navigation, an advanced debugger... With JetBrains Rider, everything you need is at your fingertips. Code C# at the speed of thought on Linux, Mac, or Windows. Try JetBrains Rider today!
© 2019 Scott Hanselman. All rights reserved.


