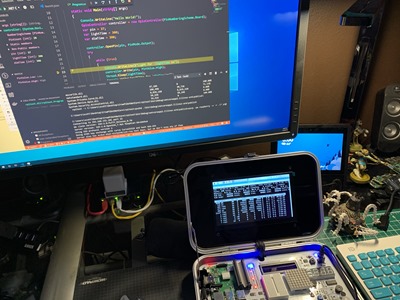
I've been playing with my new "CrowPi" from Elecrow. It's a great Raspberrry Pi STEM kit that is entirely self-contained in a small case. It includes a touch screen and a TON of sensors, LCDs, matrix display, sensors, buzzers, breadboard, etc.
NOTE: I talked to the #CrowPi people and they gave me an Amazon COUPON that's ~$70 off! The coupon is 8EMCVI56 and will work until Jan 31, add it during checkout. The Advanced Kit is at https://amzn.to/2SVtXl2
#ref and includes everything, touchscreen, keyboard, mouse, power, SNES controllers, motors, etc. I will be doing a full review soon. Short review is, it's amazing.
I was checking out daily builds of the new open source .NET Core System.Device.Gpio that lets me use C# to talk to the General Purpose Input/Output pins (GPIO) on the Raspberry Pi. However, my "developer's inner loop" was somewhat manual. The developer's inner loop is that "write code, run code, change code" loop that we all do. If you find yourself typing repetitive commands that deploy or test your code but don't write new code, you'll want to try to optimize that inner loop and get it down to one keystroke (or zero in the case of automatic test).
 In my example, I was writing my code in Visual Studio Code on my Windows machine, building the code locally, then running a "publish.bat" that would scp (secure copy) the resulting binaries over to the Raspberry Pi. Then in another command prompt that was ssh'ed into the Pi, I would chmod the resulting binary and run it. This was tedious and annoying, however as programmers sometimes we stop noticing it and just put up with the repetitive motion.
A good (kind of a joke, but not really) programmer rule of thumb is - if you do something twice, automate it.
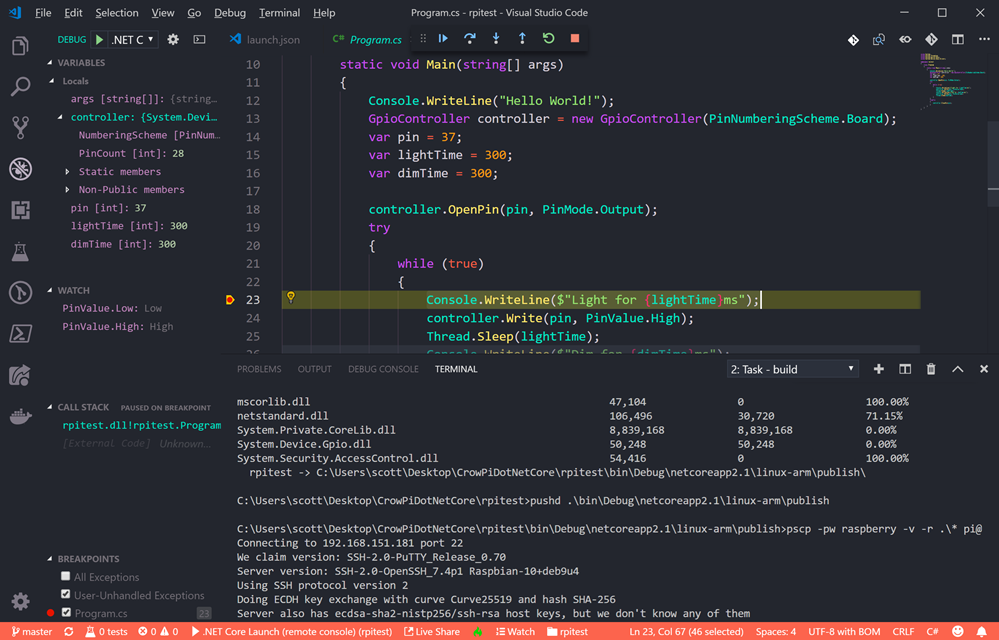
I wanted to be able not only to make the deployment automatic, but also ideally I'd be able to interactively debug my C#/.NET Core code remotely. That means I'm writing C# in Visual Studio Code on my Windows machine, I hit "F5" to start a debug session and my app is compiled, published, run, and I attached to a remote debugger running on the Raspberry Pi, AND I'm dropped into a debugging session with a breakpoint set. All with one keystroke. This is common practice with local apps, but for remote apps - and ones that span two CPU architectures - it can take a smidge of setup.
Starting with instructions here: https://github.com/OmniSharp/omnisharp-vscode/wiki/Attaching-to-remote-processes and here: https://github.com/OmniSharp/omnisharp-vscode/wiki/Remote-Debugging-On-Linux-Arm and a little help from Jose Perez Rodriguez at work, here's what I came up with.
Setting up Remote Debugging from Visual Code on Windows to a Raspberry Pi running C# and .NET Core
First, I'm assuming you've got .NET Core on both your Windows machine and Raspberry Pi. You've also installed Visual Studio Code on you Windows machine and you've installed the C# extension.
On the Raspberry Pi
I'm ssh'ing into my Pi from Windows 10. Windows 10 includes ssh out of the box now, but you can also ssh from WSL (Windows Subsystem for Linux).
- Install the VS remote debugger on your Pi by running this command:
curl -sSL https://aka.ms/getvsdbgsh | /bin/sh /dev/stdin -v latest -l ~/vsdbg - To debug you will need to run the program as root, so we'll need to be able to remote launch the program as root as well. For this, we need to first set a password for the root user in your pi, which you can do by running:
sudo passwd root - Then we need to enable ssh connections using root, by running :
sudo nano /etc/ssh/sshd_config
and adding a line that reads:
PermitRootLogin yes - reboot the pi: sudo reboot
VSDbg looks like this getting installed:
pi@crowpi:~/Desktop/rpitest$ curl -sSL https://aka.ms/getvsdbgsh | /bin/sh /dev/stdin -v latest -l ~/vsdbg

Info: Creating install directory

Using arguments

    Version                    : 'latest'

    Location                   : '/home/pi/vsdbg'

    SkipDownloads              : 'false'

    LaunchVsDbgAfter           : 'false'

    RemoveExistingOnUpgrade    : 'false'

Info: Using vsdbg version '16.0.11220.2'

Info: Previous installation at '/home/pi/vsdbg' not found

Info: Using Runtime ID 'linux-arm'

Downloading https://vsdebugger.azureedge.net/vsdbg-16-0-11220-2/vsdbg-linux-arm.zip

Info: Successfully installed vsdbg at '/home/pi/vsdbg'
At this point I've got vsdbg installed. You can go read about the MI Debug Engine here. "The Visual Studio MI Debug Engine ("MIEngine") provides an open-source Visual Studio Debugger extension that works with MI-enabled debuggers such as gdb, lldb, and clrdbg."
On the Windows Machine
Note that there are a half dozen ways to do this. Since I had a publish.bat already that looked like this, after installing putty with "choco install putty" on my Windows machine. I'm a big fan of pushd and popd and I'll tell you this, they aren't used or known enough.
dotnet publish -r linux-arm /p:ShowLinkerSizeComparison=true

pushd .\bin\Debug\netcoreapp2.1\linux-arm\publish

pscp -pw raspberry -v -r .\* pi@crowpi.lan:/home/pi/Desktop/rpitest

popd
On Windows, I want to add two things to my .vscode folder. I'll need a launch.json that has my "Launch target" and I'll need some tasks in my tasks.json to support that. I added the "publish" task myself. My publish task calls out to publish.bat. It could also do the stuff above if I wanted. Note that I made publish "dependsOn" build, and I removed/cleared problemMatcher. If you wanted, you could write a regEx that would detect if the publish failed.
{

    "version": "2.0.0",

    "tasks": [

        {

            "label": "build",

            "command": "dotnet",

            "type": "process",

            "args": [

                "build",

                "${workspaceFolder}/rpitest.csproj"

            ],

            "problemMatcher": "$msCompile"

        },

        {

            "label": "publish",

            "type": "shell",

            "dependsOn": "build",

            "presentation": {

                "reveal": "always",

                "panel": "new"

            },

            "options": {

                "cwd": "${workspaceFolder}"

            },

            "windows": {

                "command": "${cwd}\\publish.bat"

            },

            "problemMatcher": []

        }

    ]

}
Then in my launch.json, I have this to launch the remote console. This can be a little confusing because it's mixing paths that are local to Windows with paths that are local to the Raspberry Pi. For example, pipeProgram is using the Chocolatey installation of Putty's Plink. But program and args and cwd are all remote (or local to) the Raspberry Pi.
"configurations": [

       {

           "name": ".NET Core Launch (remote console)",

           "type": "coreclr",

           "request": "launch",

           "preLaunchTask": "build",

           "program": "/home/pi/dotnet/dotnet",

           "args": ["/home/pi/Desktop/rpitest/rpitest.dll"],

           "cwd": "/home/pi/Desktop/rpitest",

           "stopAtEntry": false,

           "console": "internalConsole",

           "pipeTransport": {

               "pipeCwd": "${workspaceFolder}",

               "pipeProgram": "${env:ChocolateyInstall}\\bin\\PLINK.EXE",

               "pipeArgs": [

                   "-pw",

                   "raspberry",

                   "root@crowpi.lan"

               ],

               "debuggerPath": "/home/pi/vsdbg/vsdbg"

           }

       }
Note the debugger path lines up with the location above that we installed vsdbg.

It's worth pointing out that while I'm doing this for C# it's not C# specific. You could setup remote debugging with VS Code using these building blocks with any environment.
The result here is that my developer's inner loop is now just pressing F5! What improvements would YOU make?
Sponsor: Preview the latest JetBrains Rider with its Assembly Explorer, Git Submodules, SQL language injections, integrated performance profiler and more advanced Unity support.
© 2018 Scott Hanselman. All rights reserved.


