When the engineers on the ASP.NET/.NET Core team talk to real customers about actual production problems they have, interesting stuff comes up. I've tried to capture a real customer interaction here without giving away their name or details.
The team recently had the opportunity to help a large customer of .NET investigate performance issues they’ve been having with a newly-ported ASP.NET Core 2.1 app when under load. The customer's developers are experienced with ASP.NET on Windows but in this case they needed help getting started with performance investigations with ASP.NET Core in Linux containers.
As with many performance investigations, there were a variety of issues contributing to the slowdowns, but the largest contributors were time spent garbage collecting (due to unnecessary large object allocations) and blocking calls that could be made asynchronous.
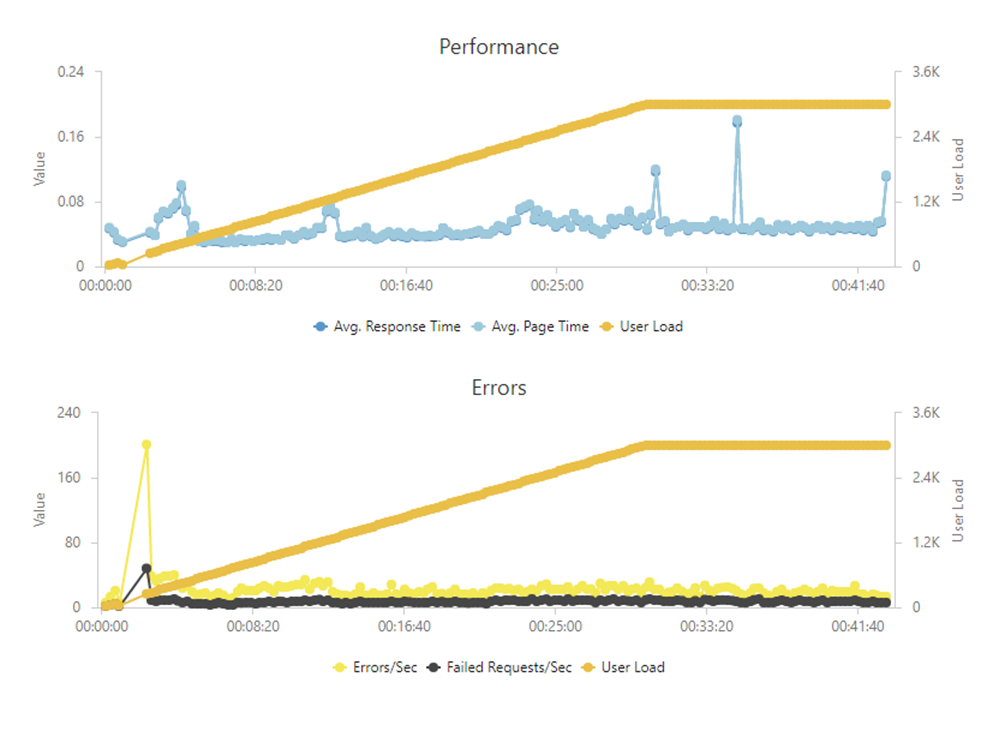
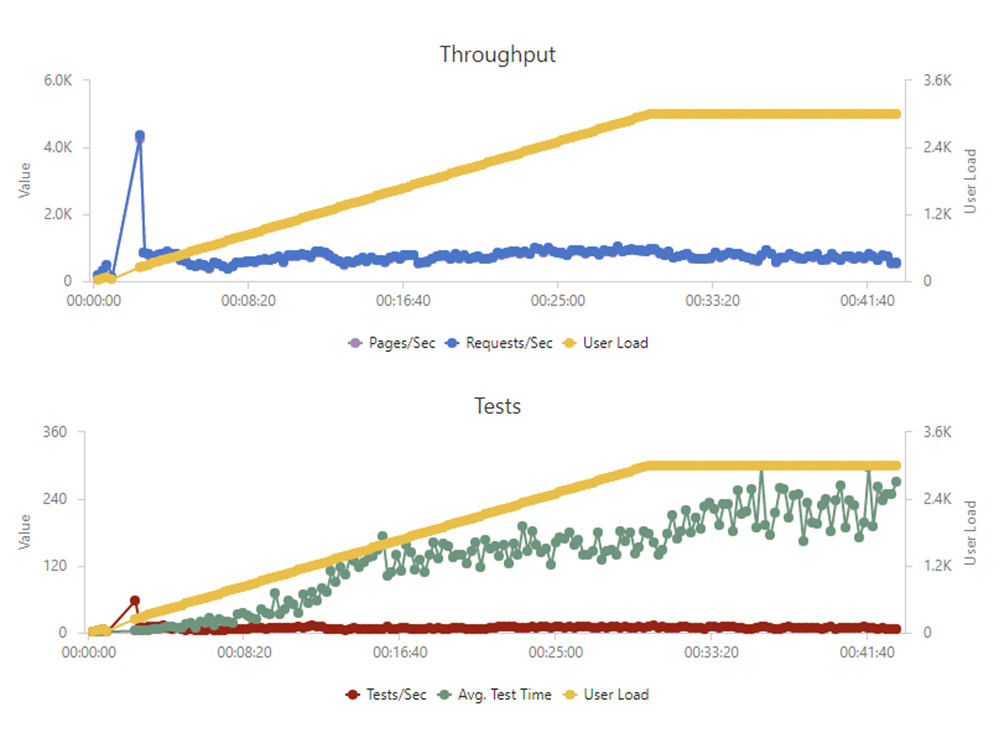
After resolving the technical and architectural issues detailed below, the customer's Web API went from only being able to handle several hundred concurrent users during load testing to being able to easily handle 3,000 and they are now running the new ASP.NET Core version of their backend web API in production.
Problem Statement
The customer recently migrated their .NET Framework 4.x ASP.NET-based backend Web API to ASP.NET Core 2.1. The migration was broad in scope and included a variety of tech changes.
Their previous version Web API (We'll call it version 1) ran as an ASP.NET application (targeting .NET Framework 4.7.1) under IIS on Windows Server and used SQL Server databases (via Entity Framework) to persist data. The new (2.0) version of the application runs as an ASP.NET Core 2.1 app in Linux Docker containers with PostgreSQL backend databases (via Entity Framework Core). They used Nginx to load balance between multiple containers on a server and HAProxy load balancers between their two main servers. The Docker containers are managed manually or via Ansible integration for CI/CD (using Bamboo).
Although the new Web API worked well functionally, load tests began failing with only a few hundred concurrent users. Based on current user load and projected growth, they wanted the web API to support at least 2,000 concurrent users. Load testing was done using Visual Studio Team Services load tests running a combination of web tests mimicking users logging in, doing the stuff of their business, activating tasks in their application, as well as pings that the Mobile App's client makes regularly to check for backend connectivity. This customer also uses New Relic for application telemetry and, until recently, New Relic agents did not work with .NET Core 2.1. Because of this, there was unfortunately no app diagnostic information to help pinpoint sources of slowdowns.
Lessons Learned
Cross-Platform Investigations
One of the most interesting takeaways for me was not the specific performance issues encountered but, instead, the challenges this customer had working in a Linux environment. The team's developers are experienced with ASP.NET on Windows and comfortable debugging in Visual Studio. Despite this, the move to Linux containers has been challenging for them.
Because the engineers were unfamiliar with Linux, they hired a consultant to help deploy their Docker containers on Linux servers. This model worked to get the site deployed and running, but became a problem when the main backend began exhibiting performance issues. The performance problems only manifested themselves under a fairly heavy load, such that they could not be reproduced on a dev machine. Up until this investigation, the developers had never debugged on Linux or inside of a Docker container except when launching in a local container from Visual Studio with F5. They had no idea how to even begin diagnosing issues that only reproduced in their staging or production environments. Similarly, their dev-ops consultant was knowledgeable about Linux infrastructure but not familiar with application debugging or profiling tools like Visual Studio.
The ASP.NET team has some documentation on using PerfCollect and PerfView to gather cross-platform diagnostics, but the customer's devs did not manage to find these docs until they were pointed out. Once an ASP.NET Core team engineer spent a morning showing them how to use PerfCollect, LLDB, and other cross-platform debugging and performance profiling tools, they were able to make some serious headway debugging on their own. We want to make sure everyone can debug .NET Core on Linux with LLDB/SOS or remotely with Visual Studio as easily as possible.
The ASP.NET Core team now believes they need more documentation on how to diagnose issues in non-Windows environments (including Docker) and the documentation that already exists needs to be more discoverable. Important topics to make discoverable include PerfCollect, PerfView, debugging on Linux using LLDB and SOS, and possibly remote debugging with Visual Studio over SSH.
Issues in Web API Code
Once we gathered diagnostics, most of the perf issues ended up being common problems in the customer’s code.
- The largest contributor to the app’s slowdown was frequent Generation 2 (Gen 2) GCs (Garbage Collections) which were happening because a commonly-used code path was downloading a lot of images (product images), converting those bytes into a base64 strings, responding to the client with those strings, and then discarding the byte[] and string. The images were fairly large (>100 KB), so every time one was downloaded, a large byte[] and string had to be allocated. Because many of the images were shared between multiple clients, we solved the issue by caching the base64 strings for a short period of time (using IMemoryCache).
- HttpClient Pooling with HttpClientFactory
- When calling out to Web APIs there was a pattern of creating new HttpClient instances rather than using IHttpClientFactory to pool the clients.
- Despite implementing IDisposable, it is not a best practice to dispose HttpClient instances as soon as they’re out of scope as they will leave their socket connection in a TIME_WAIT state for some time after being disposed. Instead, HttpClient instances should be re-used.
- Additional investigation showed that much of the application’s time was spent querying PostgresSQL for data (as is common). There were several underlying issues here.
- Database queries were being made in a blocking way instead of being asynchronous. We helped address the most common call-sites and pointed the customer at the AsyncUsageAnalyzer to identify other async cleanup that could help.
- Database connection pooling was not enabled. It is enabled by default for SQL Server, but not for PostgreSQL.
- We re-enabled database connection pooling. It was necessary to have different pooling settings for the common database (used by all requests) and the individual shard databases which are used less frequently. While the common database needs a large pool, the shard connection pools need to be small to avoid having too many open, idle connections.
- The Web API had a fairly ‘chatty’ interface with the database and made a lot of small queries. We re-worked this interface to make fewer calls (by querying more data at once or by caching for short periods of time).
- There was also some impact from having other background worker containers on the web API’s servers consuming large amounts of CPU. This led to a ‘noisy neighbor’ problem where the web API containers didn’t have enough CPU time for their work. We showed the customer how to address this with Docker resource constraints.
Wrap Up
As shown in the graph below, at the end of our performance tuning, their backend was easily able to handle 3,000 concurrent users and they are now using their ASP.NET Core solution in production. The performance issues they saw overlapped a lot with those we’ve seen from other customers (especially the need for caching and for async calls), but proved to be extra challenging for the developers to diagnose due to the lack of familiarity with Linux and Docker environments.


Some key areas of focus uncovered by this investigation were:
-
Being mindful of memory allocations to minimize GC pause times
-
Keeping long-running calls non-blocking/asynchronous
-
Minimizing calls to external resources (such as other web services or the database) with caching and grouping of requests
Hope you find this useful! Big thanks to Mike Rousos from the ASP.NET Core team for his work and analysis!
Sponsor: Check out the latest JetBrains Rider with built-in spell checking, enhanced debugger, Docker support, full C# 7.3 support, publishing to IIS and more advanced Unity support.
© 2018 Scott Hanselman. All rights reserved.


