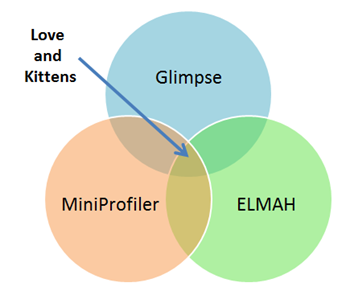
 I LOVE great debugging tools. Anything that makes it easier for me to make a site correct and fast is glorious. I've talked about Glimpse, an excellent firebug-like debugger for ASP.NET MVC, and I've talked about ELMAH, and amazing logger and error handler. Now the triad is complete with MiniProfiler, my Package of the Week #9.
Yes, #9. I'm counting "System.Web.Providers" as #8, so phooey. ;)
Hey, have you implemented the NuGet Action Plan? Get on it, it'll take only 5 minutes: NuGet Action Plan - Upgrade to 1.4, Setup Automatic Updates, Get NuGet Package Explorer. NuGet 1.4 is out, so make sure you're set to automatically update!
The Backstory: I was thinking since the NuGet .NET package management site is starting to fill up that I should start looking for gems (no pun intended) in there. You know, really useful stuff that folks might otherwise not find. I'll look for mostly open source projects, ones I think are really useful. I'll look at how they built their NuGet packages, if there's anything interesting about the way the designed the out of the box experience (and anything they could do to make it better) as well as what the package itself does.
This week's Package of the Week is "MiniProfiler" from StackExchange.
Each are small bad-ass LEGO pieces that make debugging, logging and profiling your ASP.NET application that much more awesome.
So what's it do? It's a Production Profiler for ASP.NET. Here's what Sam Saffron says about this great piece of software Jarrod Dixon, Marc Gravell and he worked on...and hold on to your hats.
Our open-source profiler is perhaps the best and most comprehensive production web page profiler out there for any web platform.
Whoa. Bold stuff. Is it that awesome? Um, ya.
The powerful stuff here is that this isn't a profiler like you're used to. Most profilers are heavy, they plug into the runtime (the CLR, perhaps) and you'd avoid messing with them at production time. Sometimes people will do "poor man's profiling" with high performance timers and log files, but there's always a concern that it'll mess up production. Plus, digging around in logs and stuff sucks.
MiniProfiler will profile not only what's happening on the page and how it renders, but also separate statements whose scope you can control with using() statements, but also database access. Each one is more amazing.
First, from an ASP.NET application, install the MiniProfiler package via NuGet. Decide when you will profile. You can't profile everything, so do you want to profile local requests, just requests from administrators, or from certain IPs? Start it up in your Global.asax:
protected void Application_BeginRequest()
{
    if (Request.IsLocal) { MiniProfiler.Start(); } //or any number of other checks, up to you
}

protected void Application_EndRequest()
{
    MiniProfiler.Stop(); //stop as early as you can, even earlier with MvcMiniProfiler.MiniProfiler.Stop(discardResults: true);
}
Add a call to render the MiniProfiler's Includes in a page, usually the main layout after wherever jQuery is added:
<head>
    <script type="text/javascript" src="https://ajax.googleapis.com/ajax/libs/jquery/1.6.1/jquery.min.js"></script>
    @MvcMiniProfiler.MiniProfiler.RenderIncludes()
</head>
The, if you like, put some using statements around some things you want to profile:
public class HomeController : Controller
{
    public ActionResult Index()
    {
        var profiler = MiniProfiler.Current; // it's ok if this is null

        using (profiler.Step("Set page title"))
        {
            ViewBag.Title = "Home Page";
        }

        using (profiler.Step("Doing complex stuff"))
        {
            using (profiler.Step("Step A"))
            { // something more interesting here
                Thread.Sleep(100);
            }
            using (profiler.Step("Step B"))
            { // and here
                Thread.Sleep(250);
            }
        }

        using (profiler.Step("Set message"))
        {
            ViewBag.Message = "Welcome to ASP.NET MVC!";
        }

        return View();
    }
}
Now, run the application and click on the chicklet in the corner. Open your mouth and sit there, staring at your screen with your mouth agape.
_3.png)
That's hot. Notice how the nested using statements are nested with their timings aggregated in the popup.
If you want to measure database access (where the MiniProfiler really shines) you can use their ProfiledDbConnection, or you can hook it into Entity Framework Code First with the ProfiledDbProfiler.
If you manage connections yourself or you do your own database access, you can get Profiled connections manually:
public static MyModel Get()
{
   var conn = ProfiledDbConnection.Get(GetConnection());
   return ObjectContextUtils.CreateObjectContext<MyModel>(conn);
}
Or, if you are using things like Entity Framework Code First, just add their DbProvider to the web.config:
<system.data>
  <DbProviderFactories>
    <remove invariant="MvcMiniProfiler.Data.ProfiledDbProvider" />
    <add name="MvcMiniProfiler.Data.ProfiledDbProvider" invariant="MvcMiniProfiler.Data.ProfiledDbProvider"
      description="MvcMiniProfiler.Data.ProfiledDbProvider"
      type="MvcMiniProfiler.Data.ProfiledDbProviderFactory, MvcMiniProfiler, Version=1.6.0.0, Culture=neutral, PublicKeyToken=b44f9351044011a3" />
  </DbProviderFactories>
</system.data>
Then tell EF Code First about the connection factory that's appropriate for your database.
I've spent the last few evenings on Skype with Sam trying to get the EF Code First support to work as cleanly as possible. You can see the checkins over the last few days as we bounced back and forth. Thanks for putting up with me, Sam!
Here's how to wrap SQL Server Compact Edition in your Application_Start:
protected void Application_Start()
{
    AreaRegistration.RegisterAllAreas();

    RegisterGlobalFilters(GlobalFilters.Filters);
    RegisterRoutes(RouteTable.Routes);

    //This line makes SQL Formatting smarter so you can copy/paste
    // from the profiler directly into Query Analyzer
    MiniProfiler.Settings.SqlFormatter = new SqlServerFormatter();

    var factory = new SqlCeConnectionFactory("System.Data.SqlServerCe.4.0");
    var profiled = new MvcMiniProfiler.Data.ProfiledDbConnectionFactory(factory);
    Database.DefaultConnectionFactory = profiled;
}
Or I could have used SQLServer proper:
var factory = new SqlConnectionFactory("Data Source=.;Initial Catalog=tempdb;Integrated Security=True");
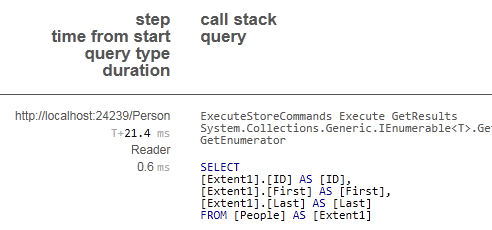
See here where I get a list of People from a database:
_3.png)
See where it says "1 sql"? If I click on that, I see what happened, exactly and how long it took.

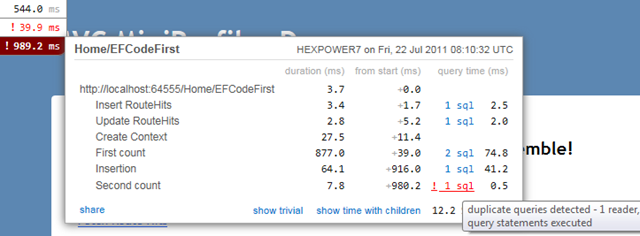
It's even cooler with more complex queries in that it can detect N+1 issues as well as duplicate queries. Here we're hitting the database 20 times with the same query!
Here's a slightly more interesting example that mixes many database accesses on one page.
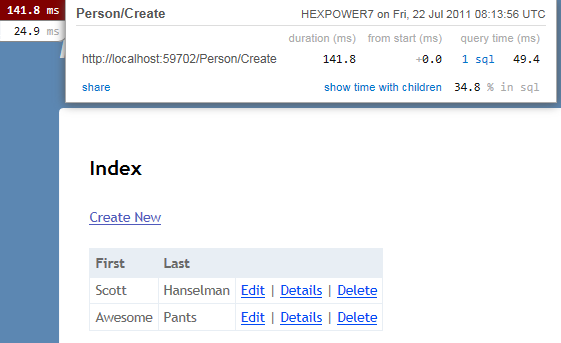
Notice that there's THREE chicklets in the upper corner there. The profiler will capture GET, POSTs, and can watch AJAX calls! Here's a simple POST, then REDIRECT/GET (the PRG pattern) example as I've just created a new Person:
Notice that the POST is 141ms and then the GET is 24.9. I can click in deeper on each access, see smaller, trivial timings and children on large pages.
I think that this amazing little profiler has become, almost overnight, absolutely essential to ASP.NET MVC.
I've never seen anything like it on another platform, and once you've used it you'll have trouble NOT using it! It provides such clean, clear insight into what is going on your site, even just out of the box. When you go an manually add in more detailed Steps() you'll be amazed at how much it can tell you about your side. MiniProfiler works with WebForms as well, because it's all about ASP.NET! There are so many issues that pop up in production that can only be found with a profiler like this.
Be sure to check out the MiniProfiler site for all the detail and to download samples with even more detail. There's lots of great features and settings to change as seen in just their sample Global.asax.cs.
Stop what you're right doing now, and go instrument your site with MiniProfiler! Then go thank Jarrod Dixon, Marc Gravell and Sam Saffron and the folks at StackExchange for their work.
Enjoy!
© 2011 Scott Hanselman. All rights reserved.

_thumb.png)

