I've blogged before about "penny pinching in the cloud." I'll update that series for 2017 soon, but the underlying concepts still apply. Many if you are still using bigger virtual machines than are needed when doing IaaS (Infrastructure as a Service) or when doing PaaS (Platform as a Service) folks are doing "one website per App Service." That's super expensive.
Remember that you can fit as many web applications as memory and CPU will into an Azure App Service Plan. An "App Service Plan" in Azure is effectively the Virtual Machine under your Web Apps. You don't need to think about it as it's totally managed and hidden - but - if you choose think about it you'll be able to squeeze more out of it and you'll pay less.
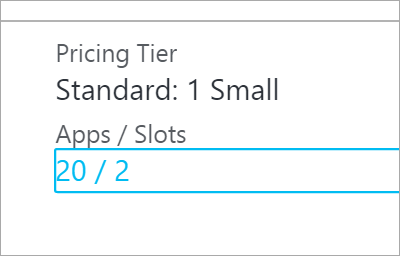
For example, I have 20 web applications running in a plan I named "DefaultServerFarm." It's a Small Standard Plan (S1) and I pay about $70 a month. Some folks use a Basic (B1) plan if they don't need to scale out and that's about $50 a month. Both B1 and S1 support "unlimited" web apps within them, to the limits of memory. That's what allows me to run 20 modest (but real) sites on the one plan and that's what makes it a good deal from a pricing perspective for me.
I logged in to the Azure Portal recently and noticed the CPU percentage on my plan was higher than usual and higher than I'd like.
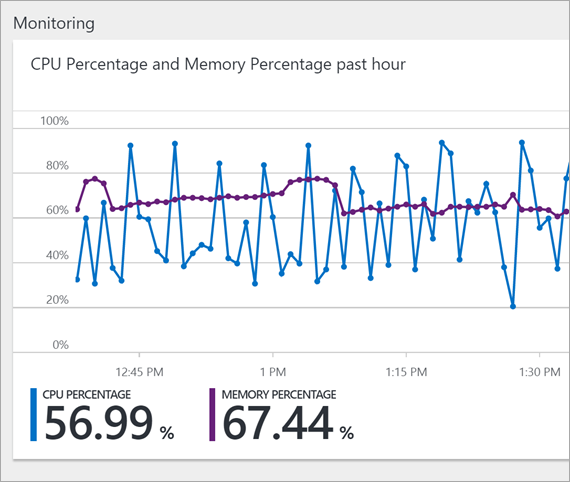
That's the CPU of the machine "under" my 20 sites. I can click here on my App Service Plan's "blade" to see the underlying sites, or just click "Apps" in the blade menu.
However, when I'm looking at an app that lives within my plan, there's two super powerful menu items to check out. One is called "Metrics per instance (Apps)" and one is "Metrics per instance (App Service)." Click the latter option. For many of you it's going to become your favorite area in the Azure Portal. It was a game changer for me as it gave me the internal insight I needed to make sure I can get maximum density in my plan (thereby saving the most money).
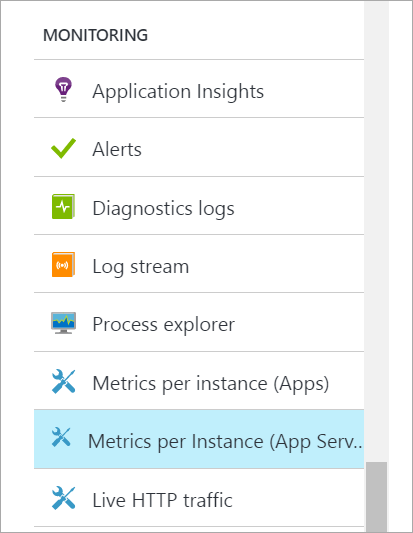
I click here and see "Sites in App Service Plan."

I can see that over the last few days my CPU has been going up and up...
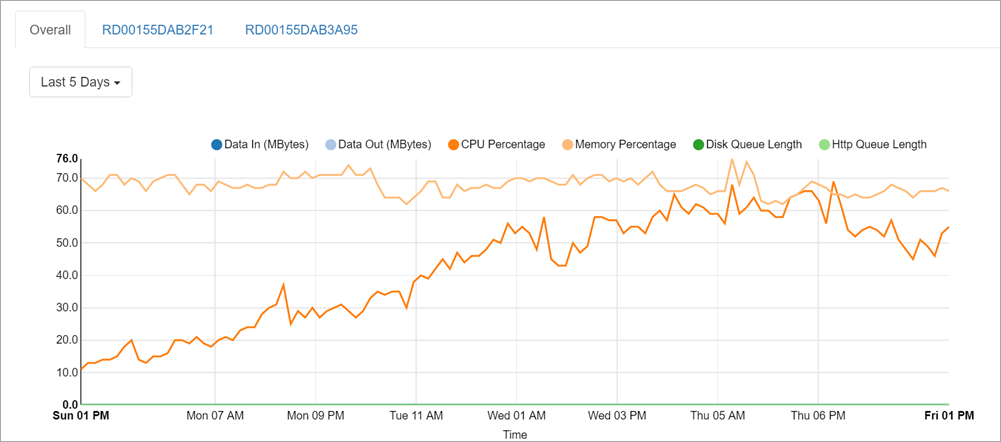
I can see by site:
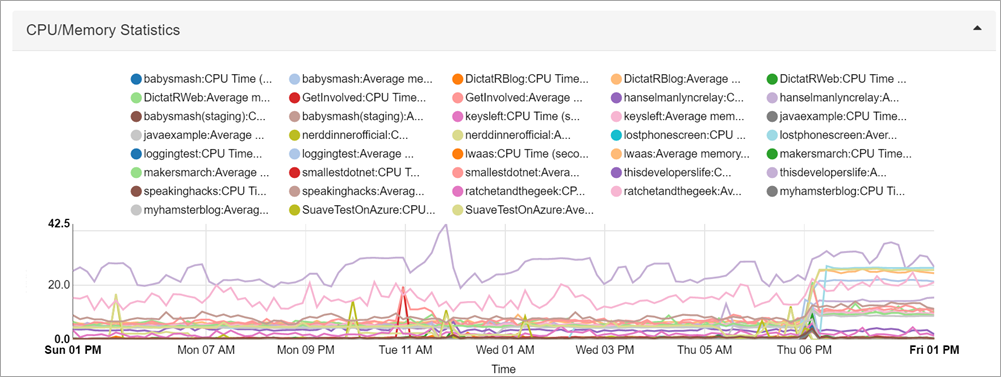
So now I can filter by site and I see that it's ONE site that's going nuts.
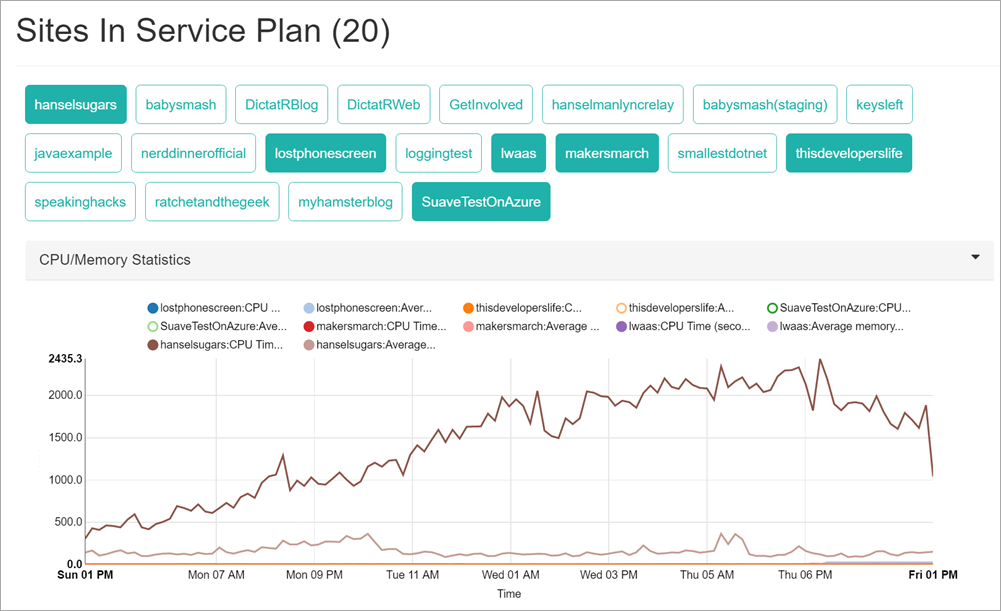
I can then dig in, go to the main CPU charge and see exactly when it started:
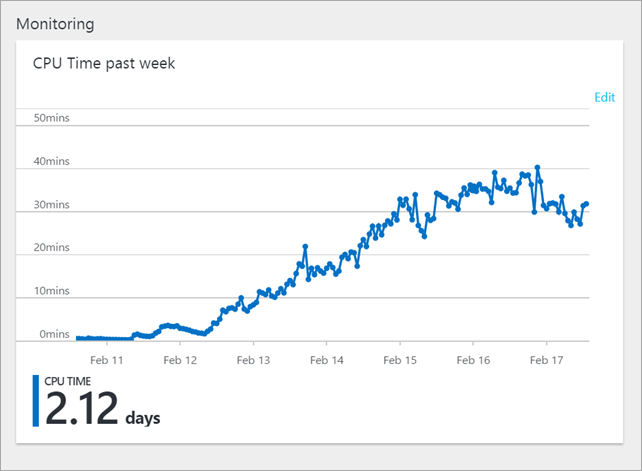
I can change the scale
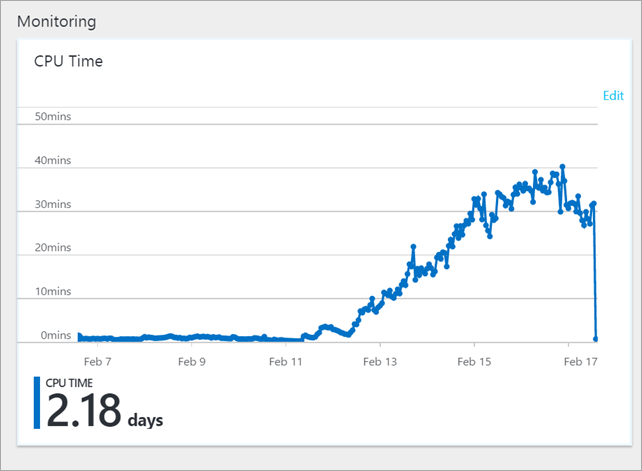
I had a Web Job stuck in a loop. I restarted and will be monitoring but for now, I'm in a much better place for this one app.
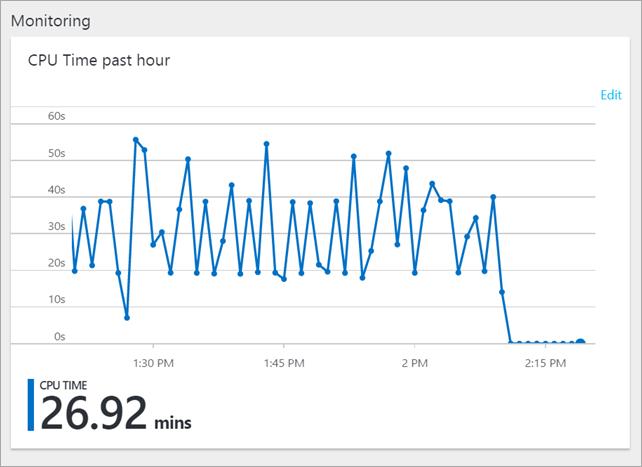
Now if I check the App Service Plan itself, I can see everything has calmed down.
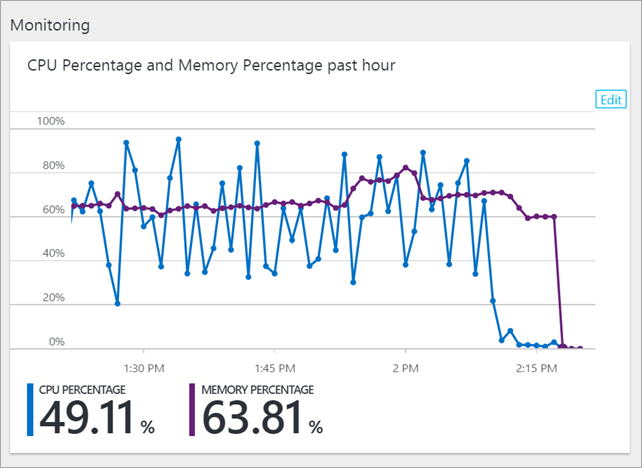
The point here is that even though it's "Platform as a Service" and we want a layer of abstraction, at no point are things HIDDEN from us. If you want to see the hardware, you can. If you want to see the process tree, you can. A good reminder.
Sponsor: Excited about the future in ASP.NET? The folks at Progress held an awesome webinar which gives a 360⁰ view of the new ASP.NET Core and how it compares to WebForms and MVC. Watch it now on demand!
© 2016 Scott Hanselman. All rights reserved.


