Today on the ASP.NET Community Standup we learned about how you can use Application Insights in a disconnected scenario to get some cool - ahem - insights into your application.
Typically when someone sees Application Insights in the File | New Project dialog they assume it's a feature that only works in Azure, that will create some account for you and send your data to the cloud. While App Insights totally does do a lot of cool stuff when you have a cloud-hosted app and it does add a lot of value, it also supports a very useful "SDK only" mode that's totally offline.
Click "Add Application Insights to project" and then under "Send telemetry to" you click "Install SDK only" and no data gets sent to the cloud.
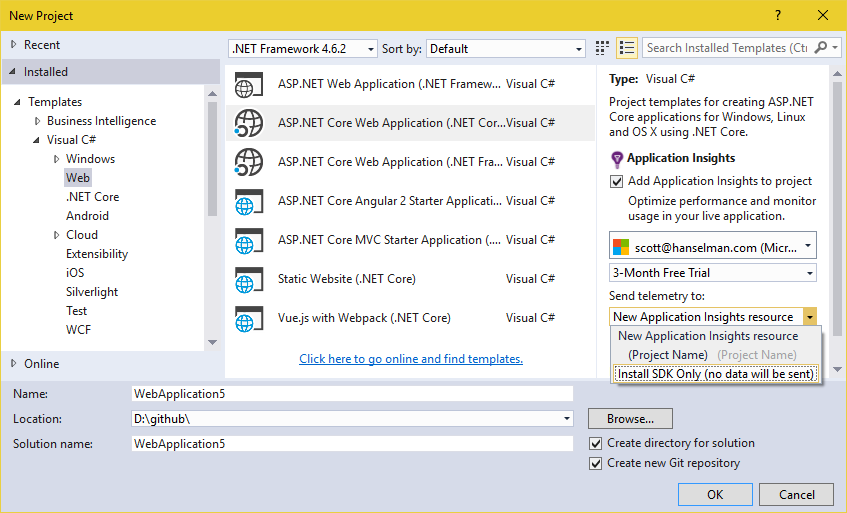
Once you make your new project, can you learn more about AppInsights here.
For ASP.NET Core apps, Application Insights will include this package in your project.json - "Microsoft.ApplicationInsights.AspNetCore": "1.0.0" and it'll add itself into your middleware pipeline and register services in your Startup.cs. Remember, nothing is hidden in ASP.NET Core, so you can modify all this to your heart's content.
if (env.IsDevelopment())

{

    // This will push telemetry data through Application Insights pipeline faster, allowing you to view results immediately.

    builder.AddApplicationInsightsSettings(developerMode: true);

}
Request telemetry and Exception telemetry are added separately, as you like.
Make sure you show the Application Insights Toolbar by right-clicking your toolbars and ensuring it's checked.

The button it adds is actually pretty useful.
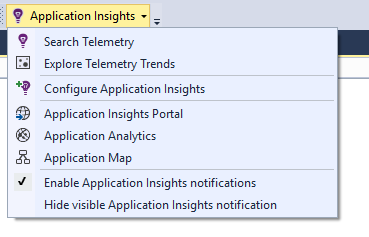
Run your app and click the Application Insights button.
NOTE: I'm using Visual Studio Community. That's the free version of VS you can get at http://visualstudio.com/free. I use it exclusively and I think it's pretty cool that this feature works just great on VS Community.
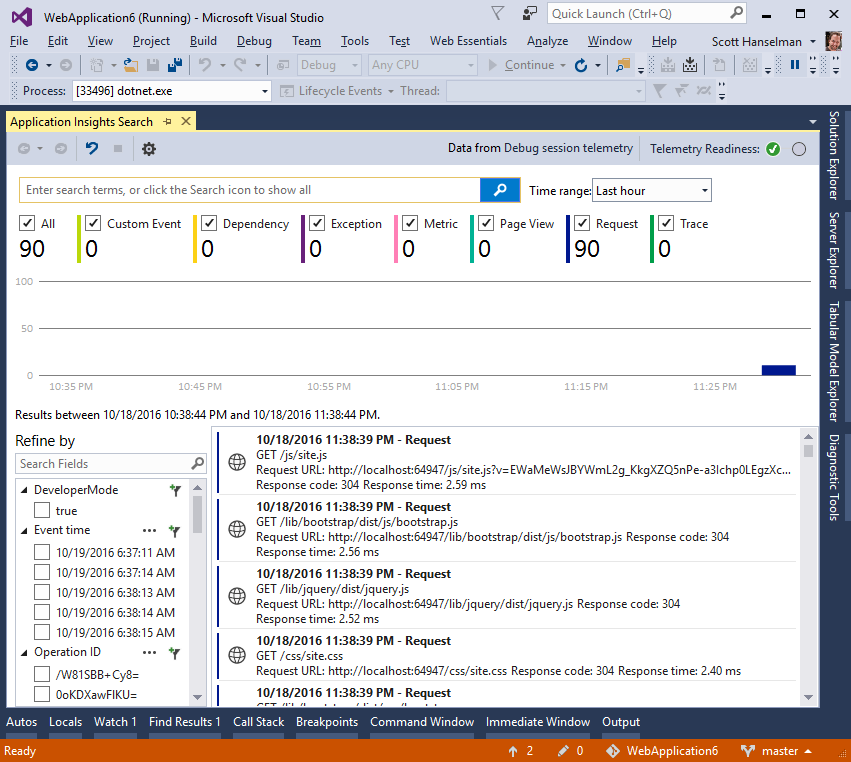
You'll see the Search window open up in VS. You can keep it running while you debug and it'll fill with Requests, Traces, Exceptions, etc.
I added a Exceptional case to /about, and here's what I see:
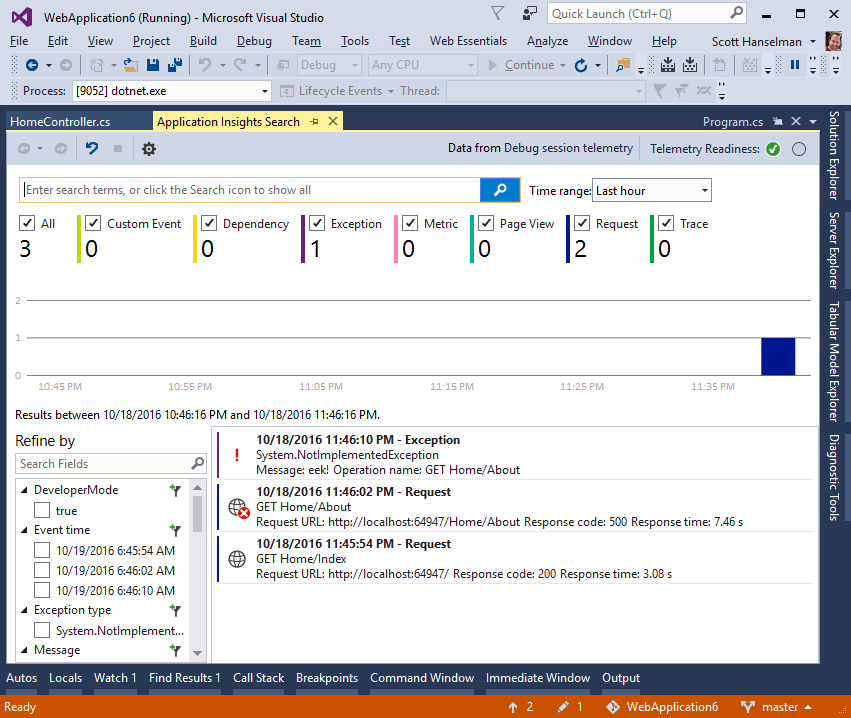
I can dig into each issue, filter, search, and explore deeper:
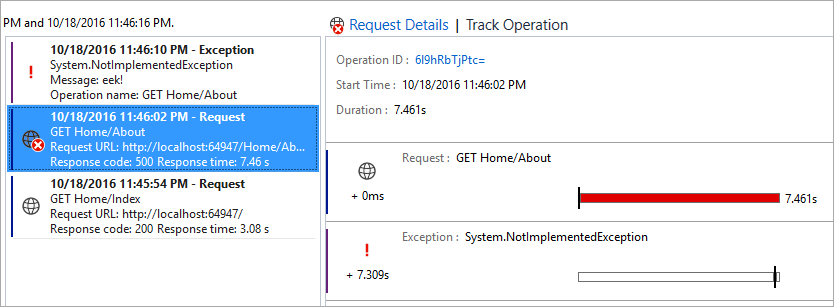
And once I've found something interesting, I can explore around it with the full details of the HTTP Request. I find the "telemetry 5 minutes before and after" query to be very powerful.
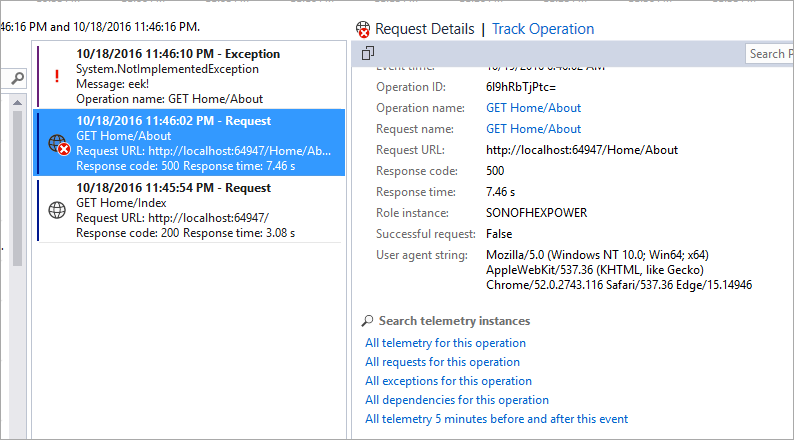
Notice where it says "dependencies for this operation?" That's not dependencies like "Dependency Injection" - that's larger system-wide dependencies like "my app depends on this web service."
You can custom instrument your application with the TrackDependancy API if you like, and that will cause your system's dependency to light up in AppInsights charts and reports. Here's a dumb example as I pretend that putting data in ViewData is a dependency. It should be calling a WebAPI or a Database or something.
var telemetry = new TelemetryClient();


var success = false;

var startTime = DateTime.UtcNow;

var timer = System.Diagnostics.Stopwatch.StartNew();

try

{

    ViewData["Message"] = "Your application description page.";

}

finally

{

    timer.Stop();

    telemetry.TrackDependency("ViewDataAsDependancy", "CallSomeStuff", startTime, timer.Elapsed, success);

}
Once I'm Tracking external Dependencies I can search for outliers, long durations, categorize them, and they'll affect the generated charts and graphs if/when you do connect your App Insights to the cloud. Here's what I see, after making this one code change. I could build this kind of stuff into all my external calls AND instrument the JavaScript as well. (note Client and Server in this chart.)
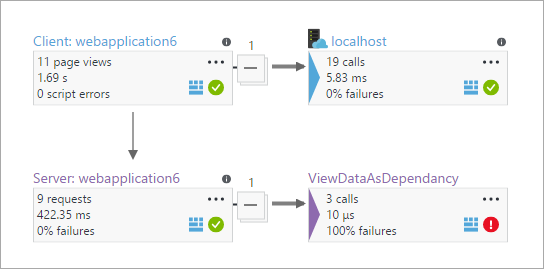
And once it's all there, I can query all the insights like this:
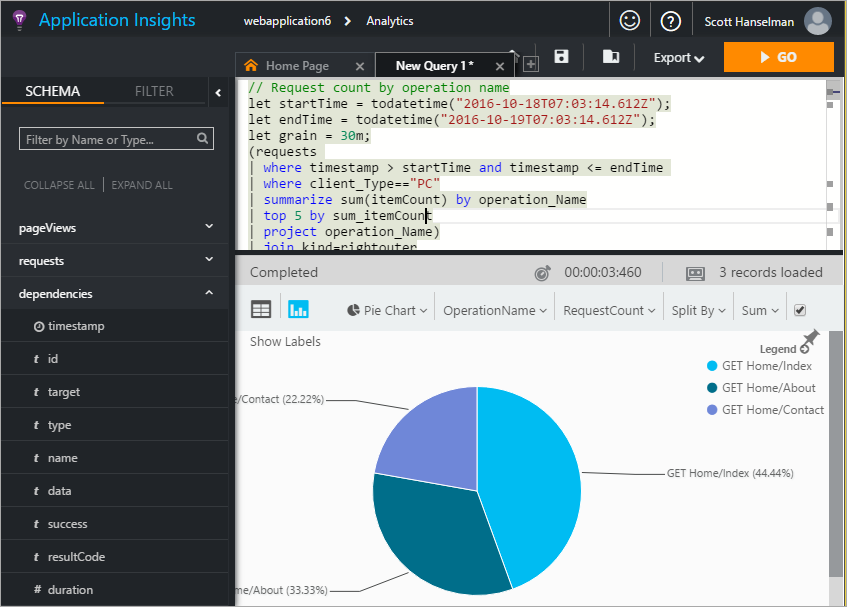
To be clear, though, you don't have to host your app in the cloud. You can just send the telemetry to the cloud for analysis. Your existing on-premises IIS servers can run a "Status Monitor" app for instrumentation.
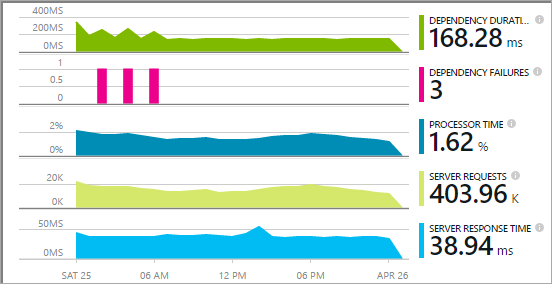
There's a TON of good data here and it's REALLY easy to get started either:
- Totally offline (no cloud) and just query within Visual Studio
- Somewhat online - Host your app locally and send telemetry to the cloud
- Totally online - Host your app and telemetry in the cloud
All in all, I am pretty impressed. There's SDKs for Java, Node, Docker, and ASP.NET - There's a LOT here. I'm going to dig deeper.
Sponsor: Big thanks to Telerik! 60+ ASP.NET Core controls for every need. The most complete UI toolset for x-platform responsive web and cloud development. Try now 30 days for free!
© 2016 Scott Hanselman. All rights reserved.


