Speedscope.app is an online "flamegraph visualizer" that you can also install offline. It's open source and on GitHub. It will allow you to view flamegraphs that have been generated by diagnostic tools, but Speedscope is good at dealing with large files without issues or crashing. There's lots of choices in viewers of flamegraphs, but this is a good one.
Adam Sitnik has a great blog about how he implemented flamegraphs for .NET.
Speedscope has a simple file format in JSON, and PerfView already exists is free and open source. PerfView is something you should download now and throw in your PATH. You'll need it someday.
We saw in the last blog post that I did a GC Dump of my running podcast site, free command line tools. Now I'll do a live running trace with
dotnet-trace
So I'll just dotnet trace ps and then
dotnet trace collect -p 18996
Which gives me this live running trace until I stop it:
Provider Name                           Keywords            Level               Enabled By

Microsoft-DotNETCore-SampleProfiler     0x0000000000000000  Informational(4)    --profile

Microsoft-Windows-DotNETRuntime         0x00000014C14FCCBD  Informational(4)    --profile


Process        : D:\github\hanselminutes-core\hanselminutes.core\bin\Debug\netcoreapp3.1\hanselminutes.core.exe

Output File    : C:\Users\scott\trace.nettrace


[00:00:00:15]   Recording trace 866.708  (KB)

Stopping the trace. This may take up to minutes depending on the application being traced.


Trace completed.
Even though this ran for just 15 seconds I collected many thousands of traces. If I need to, I can now find out EXACTLY what's happening in even short timeframes OR I can visualize what's happening over longer timeframes.
Ah, but check out this switch for dotnet trace!
--format <Chromium|NetTrace|Speedscope>
That's a useful game changer! Let's try a few, maybe Speedcope and that interestingly named Chromium format. ;)
NOTE: If you have any errors with Speedscope format, make sure to "
dotnet tool update -g dotnet-trace"
Now you'll get a something.speedscope.json that you can open and view in SpeedScope. You'll see a WEALTH of info. Remember that these formats aren't .NET specific. They aren't language specific at all. If you have a stack trace and can sample what's going on then you can make a trace that can be presented as a number of visualizations, most notably a flamegraph. This is 'how computers work' stuff, not '.NET stuff." It's great that these tools can interoperate so nicely.
There is so much info that you'll want to make you own with dotnet trace and explore. Be sure to scroll and CTRL-scroll to zoom around. Also be sure to look at the thread picker at the top center in the black title area of SpeedScope.

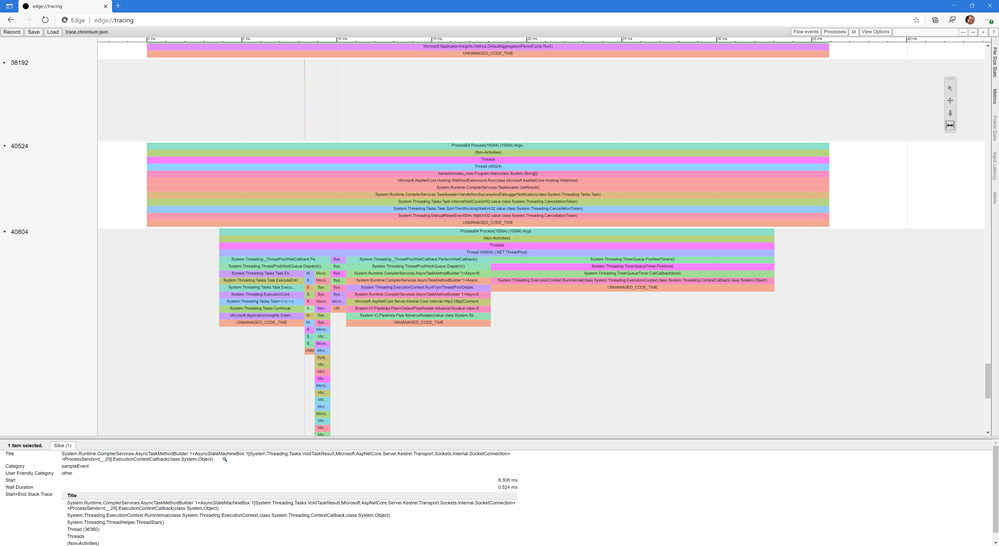
Remember how I pushed that this isn't language specific? Try going to edge://tracing/ in new Edge or in chrome://tracing in Chrome and load up a dotnet trace created with --format Chromium! Now you can use the Trace Event Profiling Tool!
Same data, different perspective! But this time you're using the tracing format that Chromium uses to analyze your .NET Core traces! The dotnet-trace tool is very very powerful.

Be sure to go read about Analysing .NET start-up time with Flamegraphs at Matt Warren's lovely blog.
Sponsor: Have you tried developing in Rider yet? This fast and feature-rich cross-platform IDE improves your code for .NET, ASP.NET, .NET Core, Xamarin, and Unity applications on Windows, Mac, and Linux.
© 2020 Scott Hanselman. All rights reserved.


