I talked about Cross-platform diagnostic tools for .NET Core and dotnet-trace for .NET Core tracing but I would be remiss if I didn't show and mention "dotnet monitor."
dotnet monitor is an experimental tool that makes it easier to get access to diagnostics information in a dotnet process. If you're running .NET Core within a container - or mostly likely in Kubernetes - this tool offers an insight into your running microservice. Basically it creates a microservice of its own that you can interrogate to better understand what's happening.
HELP! Confused about Kubernetes? Check out http://computerstufftheydidntteachyou.com and my most recent video on Kubernetes and Container Orchestration.
Assuming you have .NET Core installed, you can install dotnet monitor as a global tool:
dotnet tool install -g dotnet-monitor --add-source https://dnceng.pkgs.visualstudio.com/public/_packaging/dotnet5-transport/nuget/v3/index.json --version 5.0.0-preview.*
You then just run it along side your project or running process.
dotnet monitor collect
The developer blog on dotnet monitor shows you how you can share a volume mount between your application container and a container running dotnet monitor if you like. If you're in k8s (Kubernetes) you should run dotnet monitor as a sidecar to your container within the same pod.
It'll start up and you can talk to dotnet monitor with curl, wget, and pipe through jq and hit localhost:52323/processes to get a list of .NET Core processes it can think about.
NOTE: If you are running this locally and get auto redirected to HTTPS then you may have a cached HSTS policy for localhost from other work. Head over to edge://net-internals/#hsts (or chrome://) and scroll to the bottom and delete the Domain Security Policies for localhost.
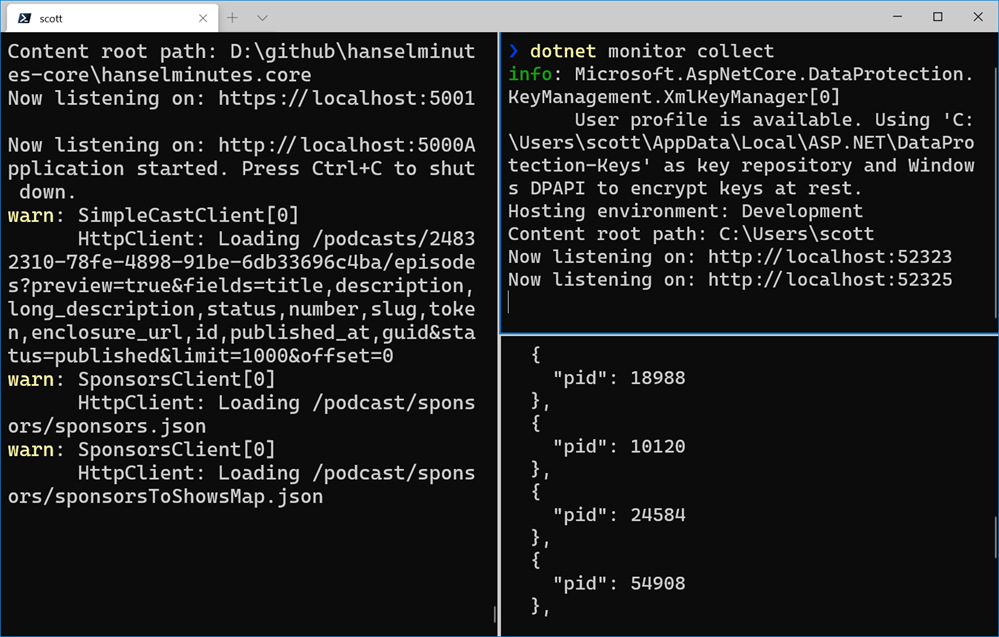
Now I can curl and see the output. I have my podcast on the left pane in Windows Terminal, dotnet monitor collect in the upper right, and the output lower right.

Once I figure out my process id (PID) - which will be automatic within a container as there will only be one - I can explore any of these local endpoints:
/processes/dump/{pid?}/gcdump/{pid?}/trace/{pid?}/logs/{pid?}/metrics
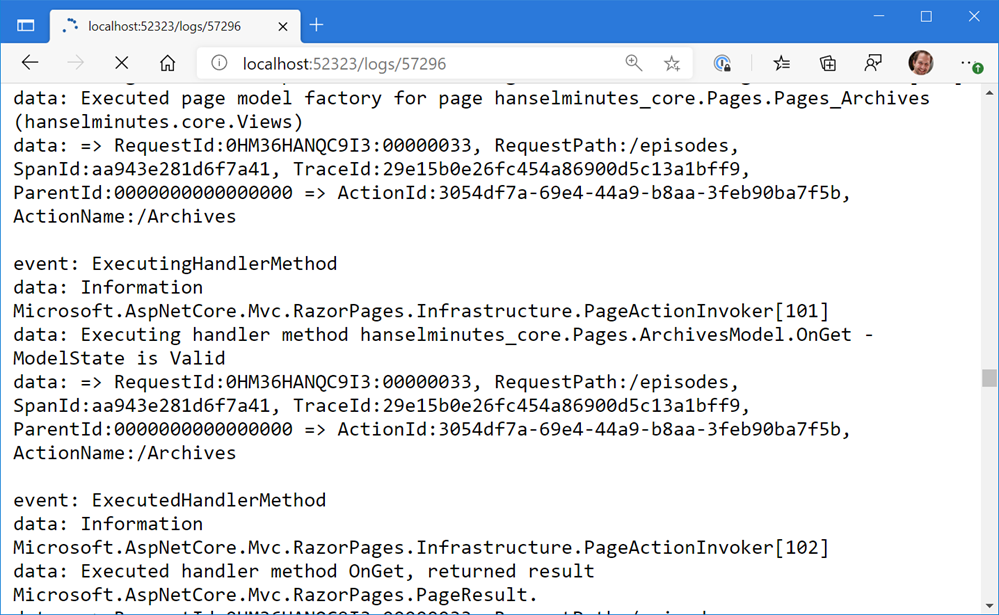
If you are getting the logs, you'll get a never ending text/event-stream in your browser. I'd recommend you "curl" to see this at the command line.

You can also get momentary traces, collect a nettrace file and analyze it in Visual Studio, PerfView or other tools.
The dotnet monitor is experimental, but if you're digging it, head over to the dotnet/diagnostics GitHub and show some support.
SOS and Other Diagnostic Tools
- SOS - About the SOS debugger extension.
- dotnet-dump - Dump collection and analysis utility.
- dotnet-gcdump - Heap analysis tool that collects gcdumps of live .NET processes.
- dotnet-trace - Enable the collection of events for a running .NET Core Application to a local trace file.
- dotnet-counters - Monitor performance counters of a .NET Core application in real time.
Hope this helps you!
Sponsor: Upgrade from file systems and SQLite to Actian Zen Edge Data Management. Higher Performance, Scalable, Secure, Embeddable in most any programming language, OS, on 64-bit ARM/Intel Platform.
© 2020 Scott Hanselman. All rights reserved.


